Help shoppers compare faster
Comparison-chart visuals make it easier for shoppers to understand sizes, feature differences, and product tiers at a glance.
Amazon comparison charts
NanoVibe helps Amazon sellers generate comparison-chart-style visuals that clarify product options, feature differences, and buying guidance on detail pages. It is useful when shoppers need to understand tiers, sizes, or versions before they convert.
Try it out
Upload your image below and let our AI do the heavy lifting. No design skills required.
Product Image
Click or drag to upload product image
Supports JPG/PNG/WEBP, up to 10MB.
No images? Try one of these
Prompt (Optional)
Benefits
Comparison-chart visuals make it easier for shoppers to understand sizes, feature differences, and product tiers at a glance.
NanoVibe helps sellers explain product fit, benefits, and alternatives more clearly on Amazon detail pages.
Teams can generate testable comparison assets without rebuilding layouts manually for every listing update.
How it works
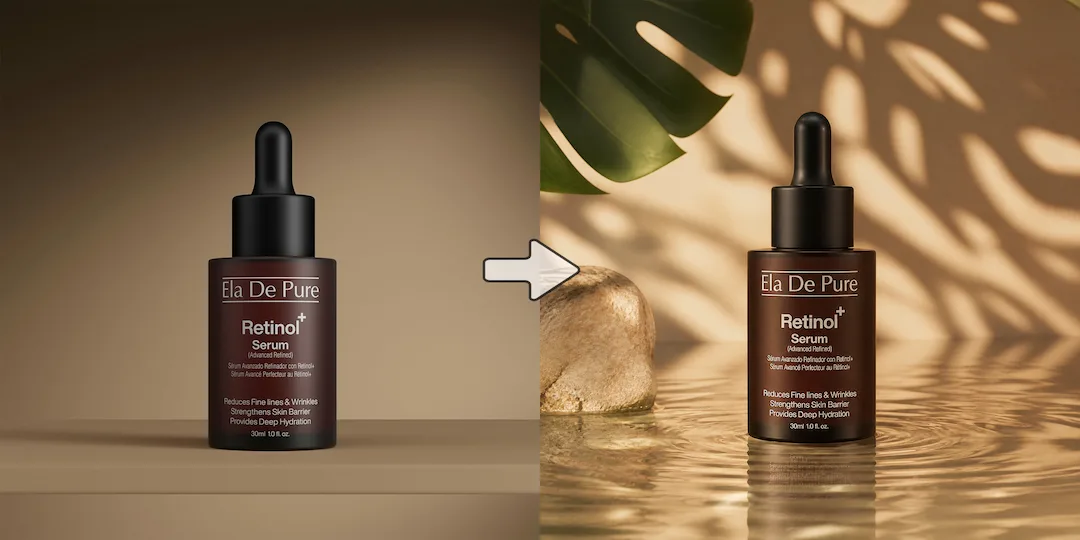
Start with the product photo or listing visual you want to turn into a comparison-oriented Amazon asset.
Choose the dimensions, feature differences, product tiers, or buying options you want the chart to communicate.
Use the strongest comparison chart across Amazon detail pages, listing tests, and supporting marketplace content.
Start now
Join thousands of professionals and creators who use NanoVibe to power their creative workflows.
Get Started For FreeFAQ
Use a comparison chart when shoppers need to choose between versions, sizes, bundles, or related products. Use a standard infographic when the goal is broader product education rather than side-by-side choice support.
Yes. Comparison charts are especially useful when shoppers need to understand sizes, materials, use cases, or differences between related products.
Yes. Infographics cover broader feature storytelling, while comparison charts focus more specifically on side-by-side differences and buying guidance.
Yes. Many sellers combine comparison charts, secondary visuals, and infographic assets to create fuller product education on detail pages.
They work best for products with several sizes, tiers, variants, bundles, or adjacent models where buyers need help choosing which option fits them best.
Explore
Create Amazon infographics for feature callouts, dimensions, and product education. Build richer Amazon listing visuals faster from one product image.
Create Amazon feature callout images for detail pages, benefit education, and listing tests. Explain key selling points faster than text bullets alone.
Create Amazon secondary images for detail pages, lifestyle context, and feature communication. Build fuller Amazon listing coverage faster.
Create Amazon lifestyle images for secondary slots, product context, and feature education. Turn plain packshots into more persuasive Amazon visuals faster.
Create Amazon product images for listings, secondary images, and updates. Build a fuller Amazon image set from one source photo faster.
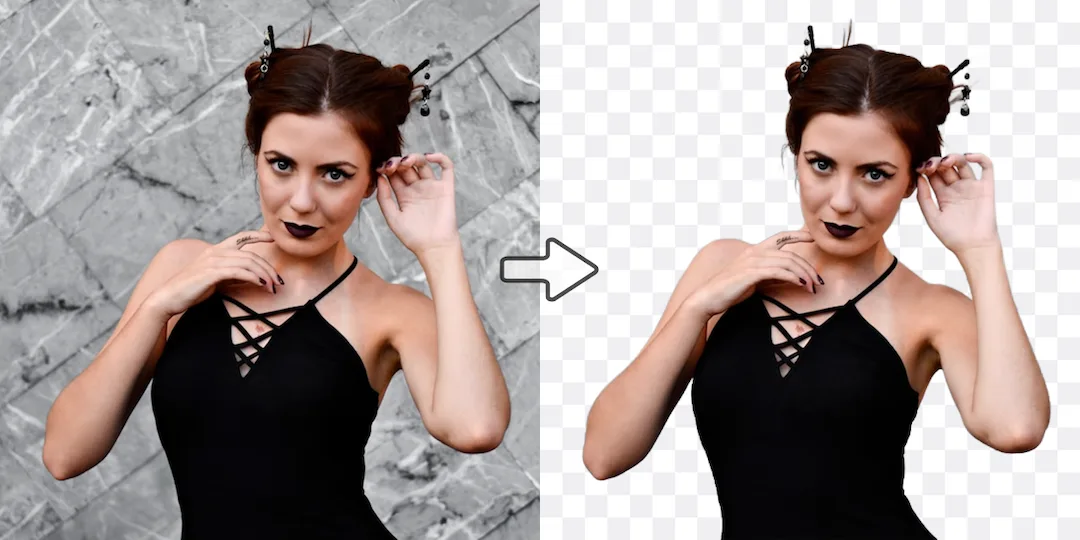
Enhance Amazon listing photos to improve sharpness, detail, and clarity. Make product images look cleaner before they go live on Amazon.
More tools